
Z-score is the statistical measurement that tells the relationship of a value with the mean of all the values in a given data. It is measured in terms of the standard deviation from the mean value. If the z-score is zero for a value in the data, it means that the value is identical to the mean of all the values.
While working on Google Sheets, we can easily calculate the z-score for a value for a given data.
How can We Calculate Z Scores in Google Sheets?
The statistical formula used to calculate the z-score for a value in a data is as follows,

Where,
X = Value for which we want to calculate the z-score.
? = The mean of all the values in the given data.
? = Standard deviation of the value from the mean of all the values.
Before we calculate the z-score for the value in a given, we have to calculate the mean value and the standard deviation between the values.
To better understand, consider the following example, in which we will calculate the z-score for each value step by step.
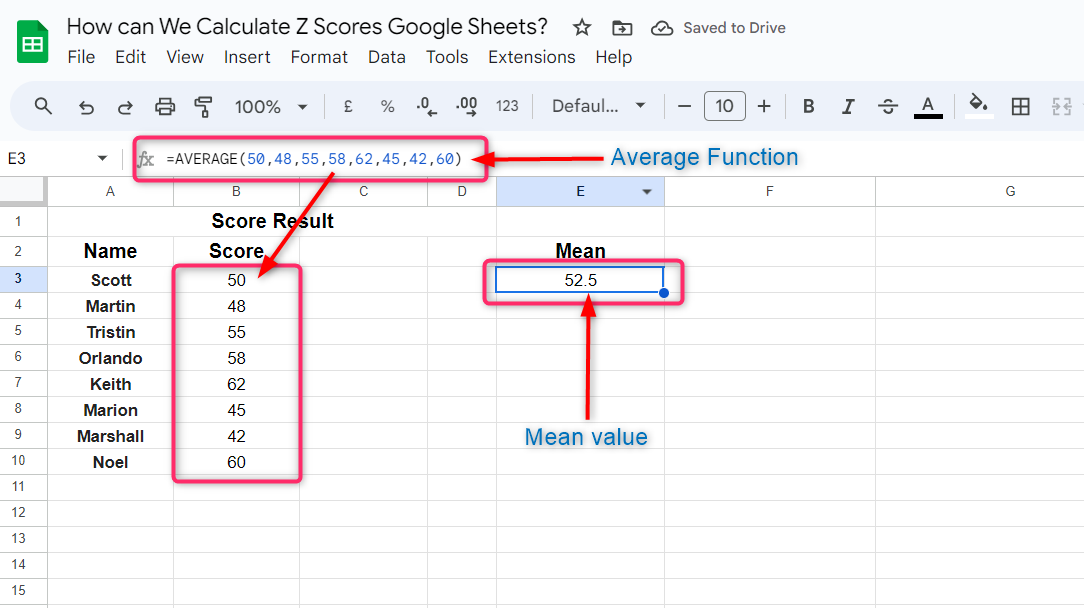
Step 1: Calculate Mean Value
Calculate the mean value of all the given data. We can use the AVERAGE() function or the MEDIAN() function to find the mean value in Google Sheets.
The syntax used for both the AVERAGE() function and the MEDIAN() function are the same, as follows:
AVERAGE() Function
AVERAGE(value1, [value2, ...])MEDIAN() Function
MEDIAN(value1, [value2, ...])Where,
value1 is the argument for the first value on which the average or mean is considered to be found.
value2 is the additional value in the data to find the average or mean value.
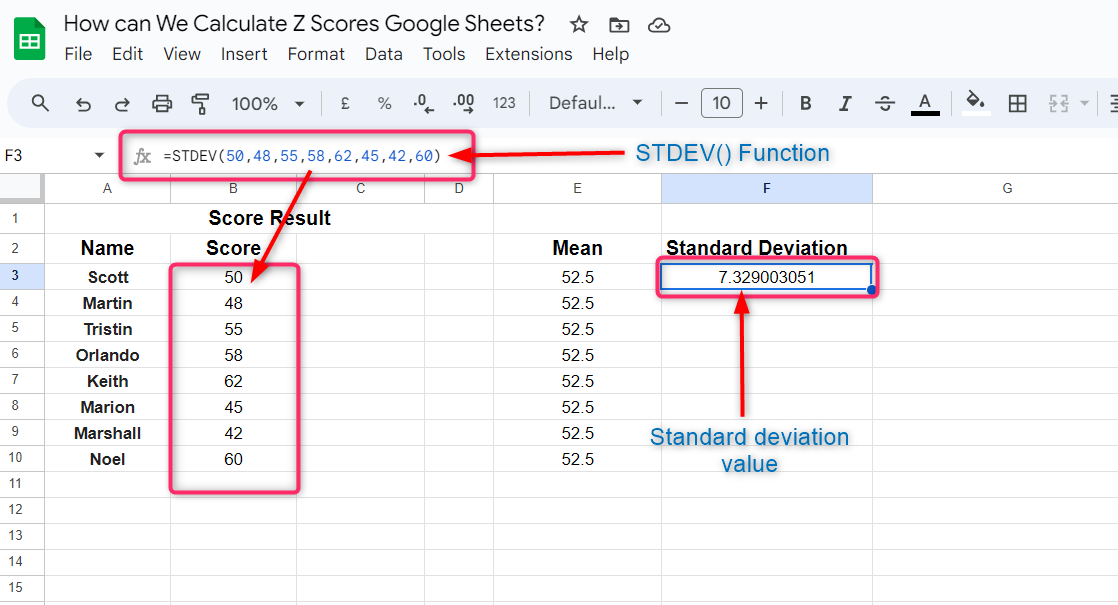
Step 2: Find Standard Deviation
Find the standard deviation of all the numerical values in the data. In Google Sheets, we calculate the standard deviation of all the numerical values in the given data using the STDEV() function.
The syntax used for the STDEV() function in Google Sheets is as follows:
STDEV(value1, [value2, ...])Where,
value1 is the first value in the data for which we want to calculate the standard deviation.
Value2 is the additional values in data to calculate the standard deviation.
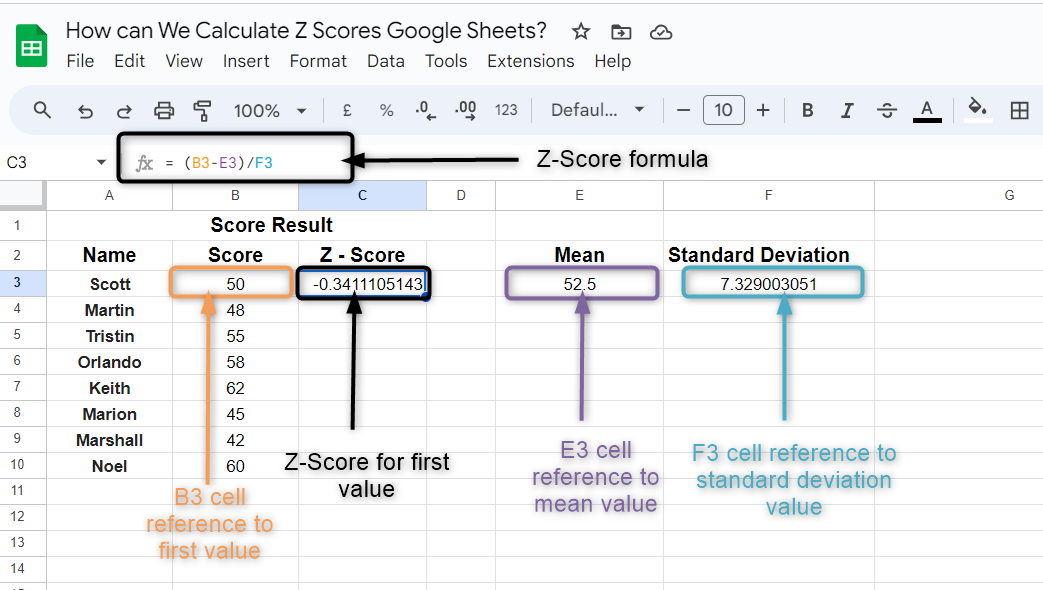
Step 3: Apply Z-Score Formula
Click on an empty cell and calculate the z-score for the first value in the data range by following the above-mentioned formula for z-score.
In Google Sheets, we use the following syntax to calculate the z-score for a value:
=(reference cell for value - reference cell for mean value) / reference cell standard deviation valueFor our example, we use the syntax as follows:
= (B3-E3)/F3Where,
B3 is the reference cell for the first value in our data.
E3 is the reference cell for the mean value we have found before.
F3 is the reference cell for the value of the standard deviation in the data.
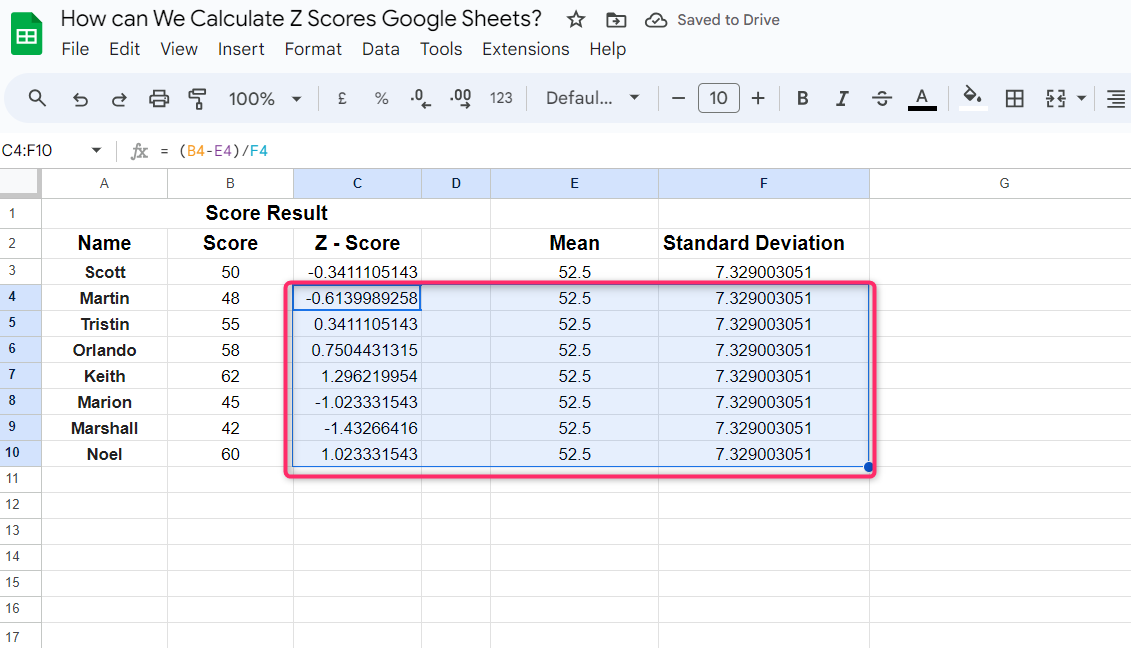
Now select the cells, containing the cells having z-score, mean value, and the standard deviation value for the first value, equal to the number of cells containing the data and press Ctrl + D.
Z-Score for all the remaining values will be calculated as follows:
Pro Tips:
- A positive value of the Z-Score means that the value deviates above the mean value, and a negative value of the Z-Score shows that the value deviates below the mean value.
- In the above example, the mean and the standard deviation values are 52.5 and 7.329003051 respectively, for our data.
Z-Score for the first value 50 is – 0.3411105143 = (50-52.5) / 7.329003051. This means that the first value 50 deviates – 0.3411105143 below the mean value.
- Similarly, Z-Score for the third value 55 in our data is 0.3411105143 = (48-52.5) / 7.329003051 which shows that value 55 deviates 0.3411105143 above the mean value.
Conclusion
The Z-score of a value shows how much the value deviates below or above the mean value in the given data. A positive z-score of any value in the data shows that it deviates above the mean value, and a negative z-score shows that it deviates below the mean value. The further away the value is from the mean value, the larger will be the z-score for that value.